After investigating what my options were to help me trace and understand the execution of my Apple 2 programs, which I write using cc65 and test using MAME, I could not find anything that would help me understand easily where I was in the code, where I was writing to or reading from, or anything.
The MAME debugger gives out hexadecimal address for both the execution address and the instructions’ parameter, and matching those with the code was a really difficult exercise, always referring to cc65’s helpful VICE labels and Debug Info files. Another complication was the banked memory, which meant “$d39a” could either mean some of my own code located in the Language Card bank 2, or the AppleSoft ROM’s BLTU2 routine.
In the end, I decided to write my own tool. It parses Debug Info files, reads a MAME execution trace, and outputs it, annotated with debug symbols when relevant (ie, not when executing ROM code or reading/writing to the Language Card bank 1).
You can download it from GitHub and build it quite simply (on GNU/Linux. I’m unsure it will work as-is on Windows, although if it doesn’t, the modifications would be quite simple to anybody wanting to trace 6502 code). Refer to the documentation on the a2trace README file for building and running it.
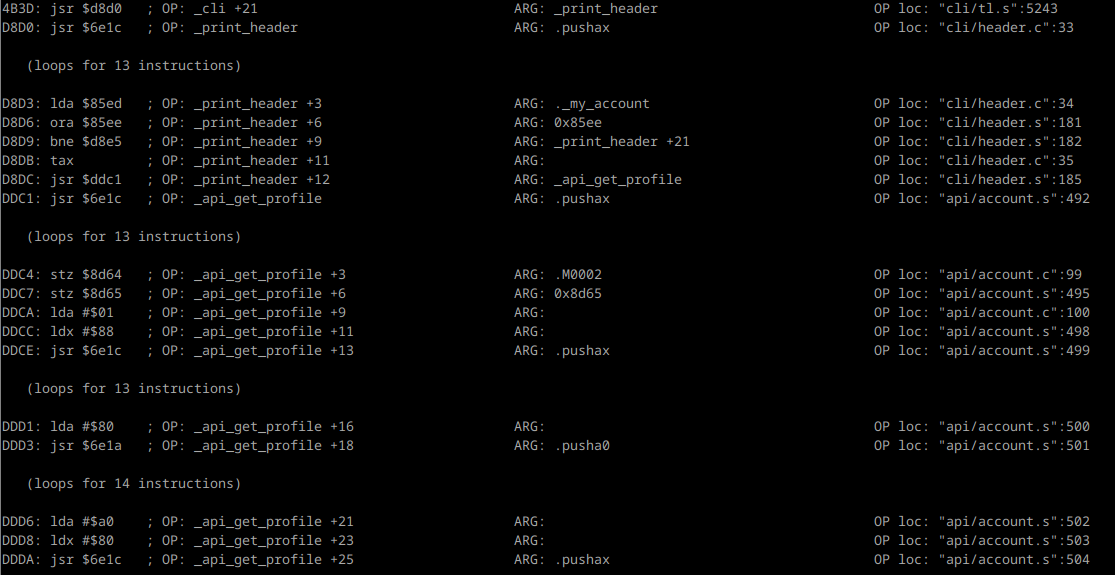
You can either run your program in MAME, quit MAME, and investigate the trace log; or you can use it in conjunction with MAME’s debugger by using its follow mode, using the -f flag, making it wait for new input from the trace file. This way, you can use MAME’s debugger features like watch points, break points, etc and refer to the annotated log to figure out things before resuming execution.
Of course, the absolute best would be to have that power directly in MAME’s debugger, but after giving a look at the code, and given that MAME emulates a lot of platforms and my tool is quite specific to cc65 Apple II programs, I don’t plan on any efforts towards that.
Update: the a2trace tool to debug and profile Apple2 programs under MAME now has its own page here!