Why?
The MAME debugger works correctly but is really limited for Apple II development. It can not import symbols, and it does not track any memory banking, so all we’re left with are hexadecimal addresses than you painstakingly match to your exports, not even being sure you’re reading your code, the ROM or the other Language Card memory page.
In order to track and fix the cc65 bug I found earlier this month, this was not going to cut it. So I set out to create a better tool to follow and understand my Apple 2 programs and my bugs, starting with what cc65 offers me: a .dbg file, and a .lbl file. Both of them contain mapping of symbols and exports to addresses. The .lbl file, aimed at VICE users, is easier to start with because it is a simple address/export pairs file. The .dbg file has a bit more information, namely the sizes of said symbols. It also lists non-exported symbols, which is more complete.
As it soon became obvious that I absolutely did not want to take a dive into MAME’s C++, QT code, I went with parsing the trace files it generates instead, and wrote a2trace. I cannot stress enough that this tool is limited to my very own need: to debug a program that a) has been built using cc65, b) for the apple2enh platform, and c) running under MAME.
How to use a2trace:
Start MAME with -debug to show the debugger window. Get ready to launch your program, and before, begin tracing CPU execution with the following MAME debugger’s command:
trace program.tr,maincpu,noloop,{tracelog "A=%02X,X=%02X,Y=%02X,P=%02X ",a,x,y,p}Run your program until you hit your bug or complete your run.
You can now interpret the program.tr log with a2trace:
a2trace -d program.dbg -t program.tr > parsed-program.tr(If needed, add -x 0x803 or the correct value for your program’s start address: if you started the trace before the previous program’s execution, say, your program.SYSTEM file, the trace would not begin in your program but in the calling one. By default, the ID01 symbol is used to get the start address).
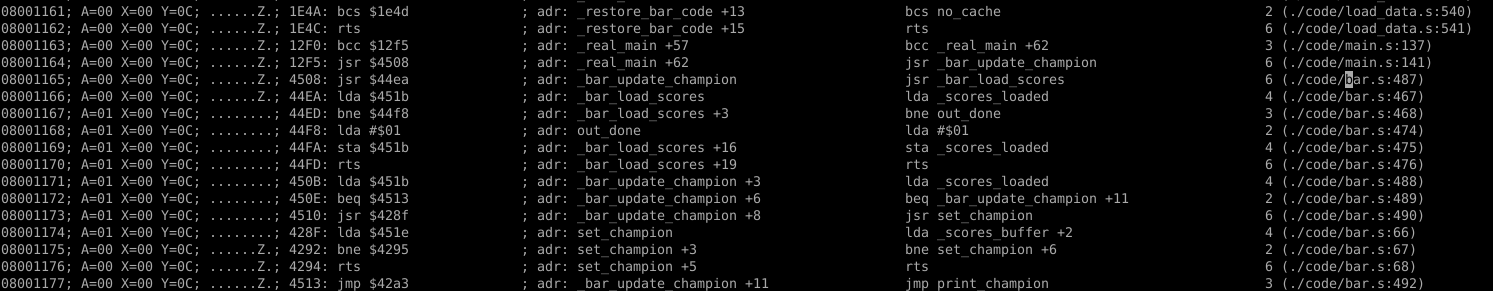
You will now have a file with debug information next to what MAME’s virtual 6502 executed:
If necessary, you can use a2trace in conjunction with MAME instead of after, using the -f parameter. This will allow you to have the annotated program log visible in a window, while using MAME’s debugger to set watchpoints, breakpoints, dump memory, or whatever you need to squash this bug!
If your trace starts at the program start address, it will be possible for a2trace to check the stack state across the trace and warn you if there are any stack imbalances (like a pushed but not pulled register inside a subroutine).
It is possible to exclude files or segments from symbol resolving, which is useful if your program replaces code in the same memory space and you have multiple symbols for the same addresses.
Finally, a2trace tries to follow writes to memory, which allows it to resolve the destination addresses in indirect Y-indexed addressing mode:
[...] A=10 X=10 Y=05; ... 178D: lda ($8a), y [...] ; lda _my_pusher0 +5Profiling:
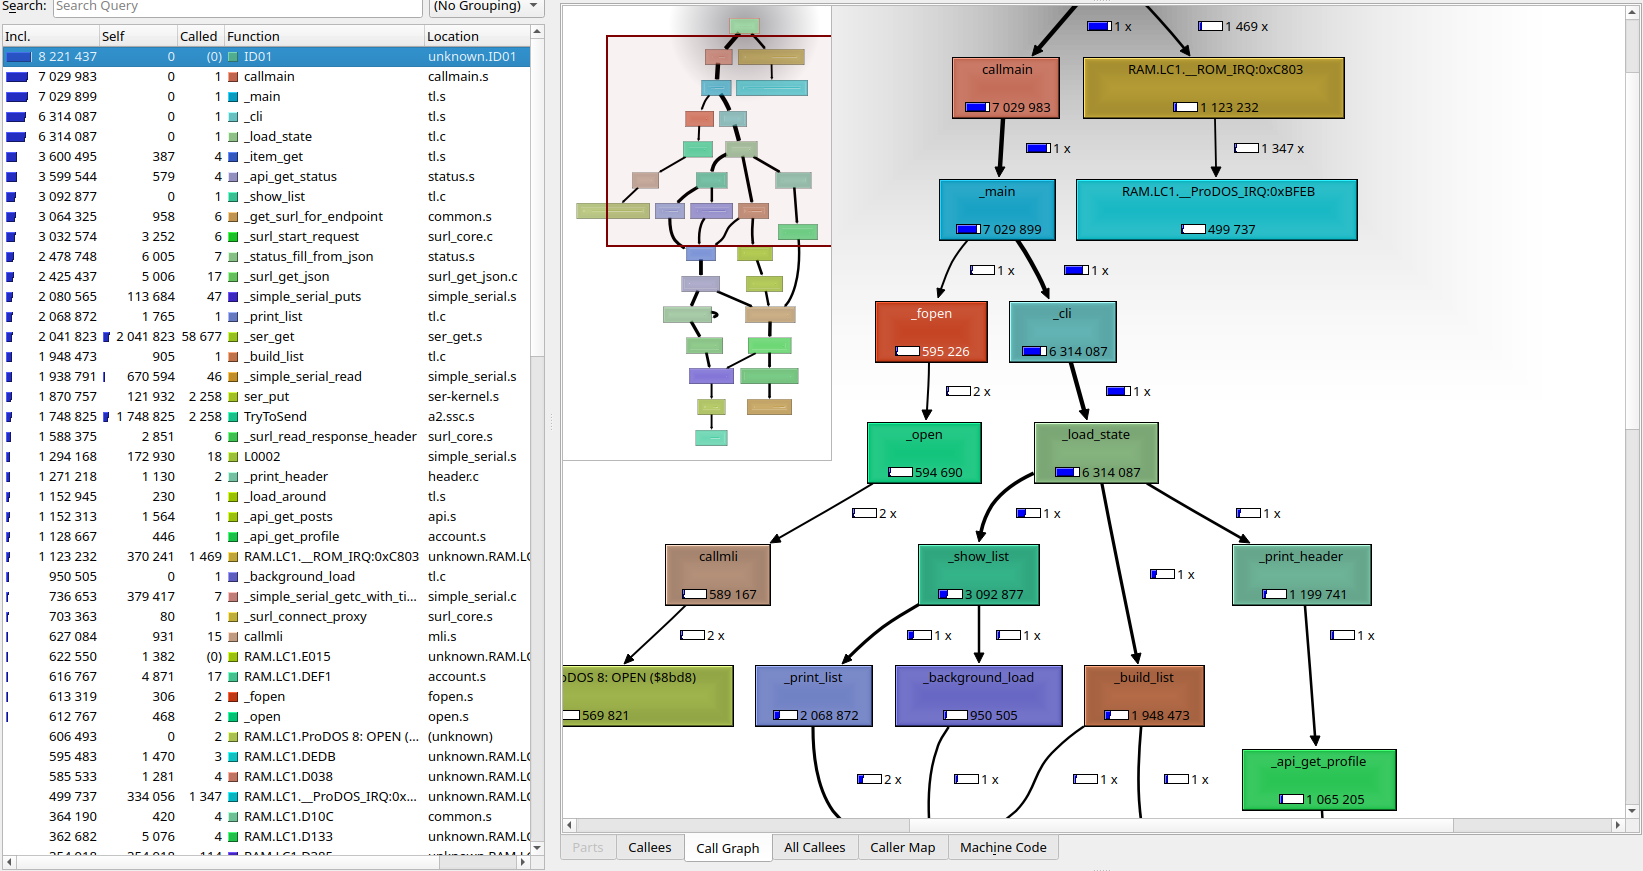
You can also profile your code using the same “program.tr” trace file and a2trace, using the -p parameter:
a2trace -d program.dbg -t program.tr -p > program.callgrindYou can now open this file with KCachegrind and figure out where your program spends time. You should get something like this:
You can also ask a2trace to count cycles between symbols or adresses. It takes a single parameter so counts cycles between two points where the start of the symbol name matches your query, so you can see how many cycles are spent between different steps by having symbols prefixed the same way. For example,
a2trace -d program.dbg -t program.tr -c redraw_ > t.trWill count cycles between each redraw_* symbols, and you get a trace like:
00000289; [...]     ; adr: redraw_wait_vbl (27 cyc) ...
00005160; [...]     ; adr: redraw_got_vbl (16954 cyc) ...
00005170; [...]     ; adr: redraw_far_side_start (35 cyc) ...
00005608; [...]     ; adr: redraw_close_side_clear_start (1511 cyc) ...
00007086; [...]     ; adr: redraw_close_side_draw_start (4884 cyc) ...
00008840; [...]     ; adr: redraw_close_side_draw_end (6041 cyc) ...
00009248; [...]     ; adr: redraw_wait_vbl (1342 cyc) ...
Installation:
The tool is available at my Apple2 GitHub repository; Installing it should be a matter of:
git clone git@github.com:colinleroy/a2tools.git
cd a2tools/src/a2trace
make && sudo make install
Hope this helps!
Note: the tool badly supports the IIgs’ 65816. It can provide a bit of help, but memory banks are not supported; The new instructions are not supported so profiling does not work at all.